Alert Management
The Alert Management tool displays all alerts that are being generated by any of the Verba services on any of the servers.
These alerts are sent out in emails or SNMP traps are used, but they are always displayed on the Alert Management page as well. For more information on what types of alerts exist in Verba, refer to the Alerts article. To see how SNMP traps can be configured or how SCOM can be used among others, refer to the System Monitoring article.
The tool can be accessed by navigating to the System -> Alert Management menu.
The alerts have different severity values:
- Warning
- Error
- Critical
- Fatal
When an alert is raised, it automatically enters the Active state. This means that it is a new alert, which has not been seen by any of the administrators, yet. Upon receiving a notification of an alert being raised, the administrators have the ability to change the status of the alert to either of the following 2 options:
- Acknowledged - This state suggests, that the administrators have seen and are aware of the issue and are working on solving the problem.
- Cleared - This state shows, that the issue has been resolved either automatically by the system (i.e. Database connection went down and up because of network issues) or manually by the system administrators. The status, however, always needs to be changed manually, even if the issue has been solved by the system.
The alerts can be restored to Active, Acknowledged or Cleared state, from any of the other states.
Handling Alerts
To change the state of an individual alert, click on the alert, then at the bottom of the page, select the desired state.
Two bulk status change of alerts are possible on the alert list page:
- Top right URLs which are changing the state of the entire search result through the paging as well
- Checkboxes at each alert, if any of the checkboxes checked three buttons appear at the bottom of the list which can be used for changing the selected alerts. On the top of the list Check All option is also available which checks or unchecks the displayed alerts.
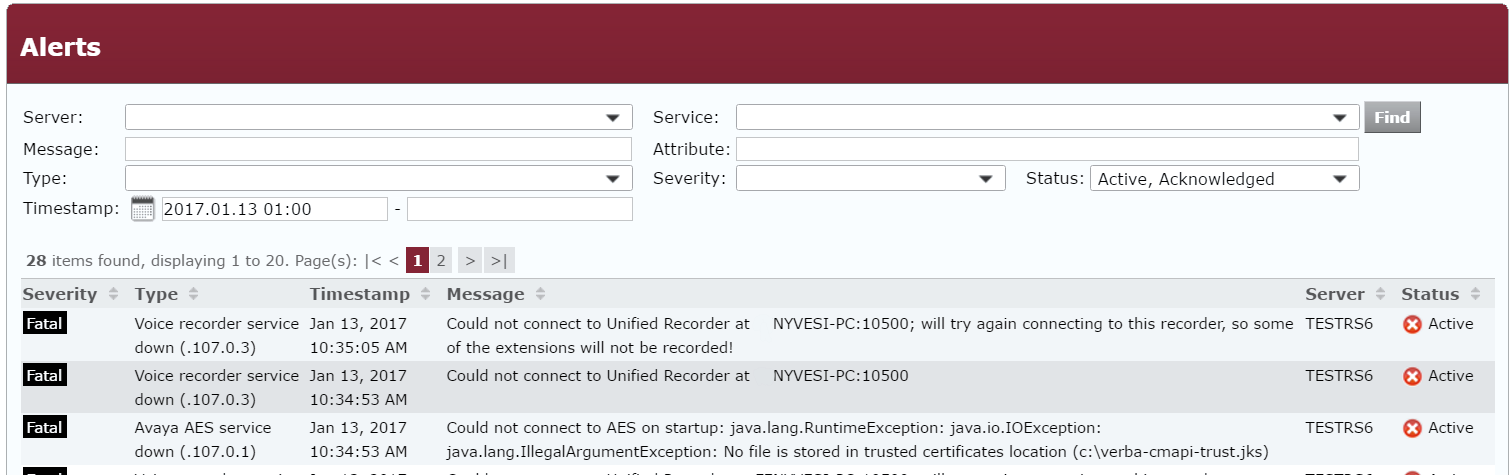
Searching Alerts
By default, all alerts are shown, but the search options at the top of the page can be used to narrow down the results. The following search criteria exist:
| Criterion | Description |
|---|---|
| Timestamp | Select a time range. This refers to the time when an alert was raised |
| Server | This can be used to only show alerts generated on a certain machine |
| Service | This can be used to only show alerts generated by a certain service |
| Message | Searches in the message content of the alerts, which describes the exact |
| Attribute | Different alerts can have different attributes, such as a Call ID for a failed call. The field can be used to search for these values |
| Type | There are a certain number of existing alert types, the search can be narrowed down to show only the selected events |
| Severity | The severity types, going from least severe to most severe are: Warning, Error, Critical, Fatal |
| Status | The options are: Active, Acknowledged, Cleared |
Upon selecting an alert, the Alert Details page opens up.
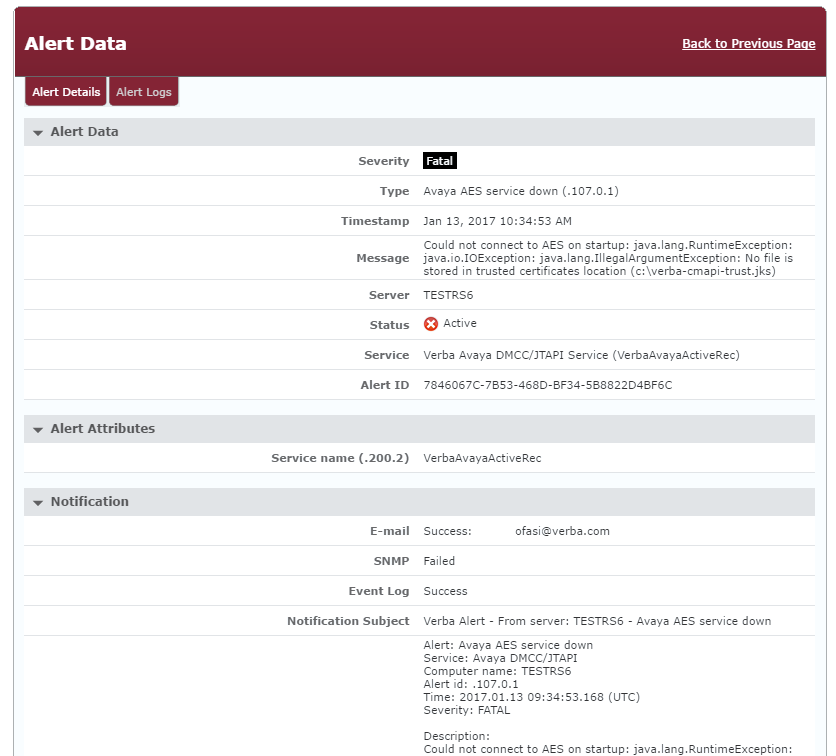
This page shows all of the details on the alert, including which server it was raised on, by which service. It also shows if an email or an SNMP trap has been successfully sent and if the system managed to write the events into the Windows Event Log. This is also visible on the Alert Logs page, which can be accessed by clicking on the Alert Logs tab at the top left corner.